
Your Complete Market Intelligence & Trading Workspace
Institutional-grade multi-timeframe charts, automated candlestick pattern recognition, multi-matrix stock diagnostics, and lightning-fast algorithmic screening — all unified under a single collaborative workspace.




10,000+ Active Traders
Breakout Radar
14 Stocks Triggered
4,000+
Active Equities & Indices Screened
< 1.2s
Real-Time Tick Processing Latency
25+
Technical Indicators & Matrix Diagnostics
What You Can Do
Find answers with next-generation charting tools, matrix algorithms, and multi-factor scanners built specifically for high-conviction traders and market analysts.
Multi-Timeframe Advanced Charting
High-performance technical charting equipped with 25+ indicators, automated candlestick pattern recognition, and custom multi-timeframe profiling built for rapid analysis.
- 25+ Technical Indicators (RSI, MACD, Supertrend, Bollinger Bands, ATR, SMA/EMA)
- Automated Candlestick Pattern Detection (Doji, Engulfing, Hammer, Morning Star)
- Multi-Timeframe Volume Profiling with Real-Time Tick & Candle Feeds
- Save custom indicator templates & crosshair synchronization
Comprehensive Stock X-Ray Diagnostics
Deep multi-dimensional stock evaluation across Relative Rotation Grade (RRG), Stan Weinstein 4-Stage lifecycle identifier, candle spread control, and historical circuit analytics.
- Relative Rotation Grade (RRG) Quadrants: Leading, Weakening, Lagging, Improving
- Stage Identifier: Automatic Accumulation, Markup, Distribution & Markdown zones
- Candle Spread & Buyer vs Seller Dominance Index
- Historical Upper & Lower Circuit Channel Diagnostics

Real-Time Multi-Factor Screening Engine
Screen 4,000+ equities across 17+ matrix groups in milliseconds. Identify volume surges, momentum breakouts, and bell-curve statistical outliers instantly.
- 17+ Comprehensive Screening Groups (Price Action, Technicals, Matrix Scores)
- Live Breakout Radar with Instant Momentum Trigger Alerts
- Save, Export, and Track Custom Screener Presets
- Instant one-click bridge to Charting & Stock X-Ray for full diagnostic inspection

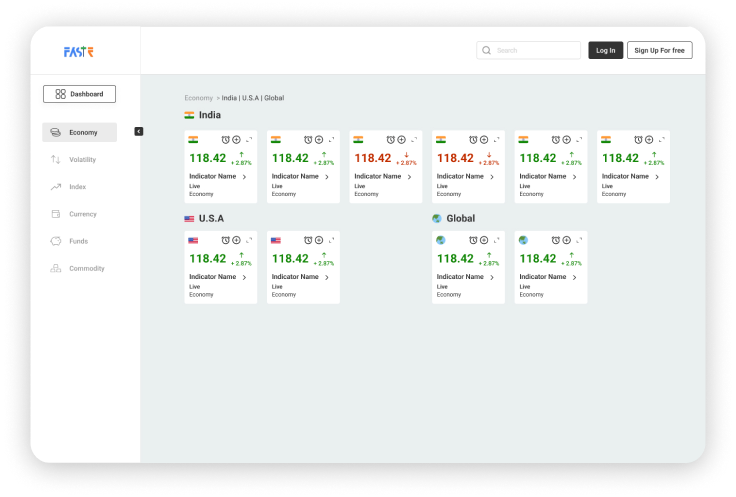
Global Macroeconomic & Sector Trends
Understand market direction before trading individual stocks. Monitor institutional capital flows (FII/DII), commodities, currency correlations, and sector rotation cycles.
- Daily & Monthly Institutional Flow Trackers (FII, DII, Client, Prop desks)
- Sector Heatmap & Relative Sector Outperformance Matrix
- Global Indices, Crude, Gold, Bond Yields & Dollar Index Correlations
- Economic Calendar & Major Policy Announcement Trackers

Systematic Options Analytics & Live Chain Matrix
Institutional-grade option chain analytics with real-time Greek diagnostics, open interest shifts, max pain calculation, and multi-leg strategy payoff analysis.
- Real-Time Option Chain Matrix with live Greeks (Delta, Gamma, Vega, Theta)
- Open Interest (OI) Build-Up & Unwinding Heatmap by Strike
- Max Pain, Put-Call Ratio (PCR) & Strike Shift Visualizer
- Multi-Leg Strategy Builder with Instant Risk-Reward & Payoff Curves
How Does It Work?
From screening market noise to identifying high-probability setups in 4 straightforward steps.
Select Your Asset
Choose from 4,000+ equities, benchmark indices (NIFTY, BANKNIFTY), or high-beta derivatives.
Screen & Filter
Run statistical bell-curve filters, 17+ matrix groups, or live momentum breakout radar triggers.
Analyze Diagnostics
Inspect RRG quadrant zone, 4-Stage market lifecycle, candlestick patterns, and options Greeks.
Execute with Edge
Take high-conviction trades with quantified risk-reward setups and systematic rules.
Everything You Need On One Platform
Engineered to remove friction from your daily trading routine and provide institutional-level clarity.
Real-Time Alerts
Instant notification for stage breakouts, volume explosions, and momentum radar triggers.
Multi-Asset Analysis
Cross-evaluate stocks, sector indices, currency pairs, commodities, and derivatives in one screen.
AI Pattern Recognition
Automated candlestick detection across 15+ patterns with historical reliability scoring.
Risk Management
Quantify risk-reward ratios, max pain thresholds, circuit hit probabilities, and strike exposures.
Institutional Flow Tracking
Track Smart Money footprint, FII/DII buy-sell figures, and sector rotation momentum cycles.
Single Sign-On (SSO) Ready
Log in once and seamlessly glide across Stock X-Ray, Scanner, Charting, Macro Pulse, and Derivatives.
Flexible Plans For Every Trading Style
Choose the duration that fits your schedule. Bundle discounts automatically applied at checkout.
Monthly
billed monthly
Ideal for active traders seeking flexible month-to-month access.
Quarterly
billed every 3 months (Save 10%)
Best for swing and momentum traders focusing on quarterly market cycles.
Annual
billed yearly (Save 28%)
The complete institutional suite for serious traders and market professionals.
Half-Yearly
billed every 6 months (Save 16%)
Optimal balance between commitment and maximum savings.
Frequently Asked Questions
Have questions about how MOM-Z14 powers your trading? We’ve got answers.

Ready to Trade Smarter?
Join thousands of disciplined traders who rely on MOM-Z14 every morning to filter noise, spot real setups, and protect their capital.
Trusted by Traders Who Plan Ahead
See how professional traders leverage MOM-Z14 tools to execute with discipline.
"The Stock X-Ray matrix and 4-Stage lifecycle identifier completely transformed how I pick stocks. Instead of getting chopped in stage-1 consolidation, I enter right at the markup stage."
Rohit Mehta
Full-Time Derivatives & Swing Trader
"Having multi-timeframe charts, real-time breakout scanner, and options Greeks under one unified SSO workspace saves me hours of manual charting across multiple portals."
Ananya Deshmukh
Quantitative Analyst & Fund Manager